
 |
|
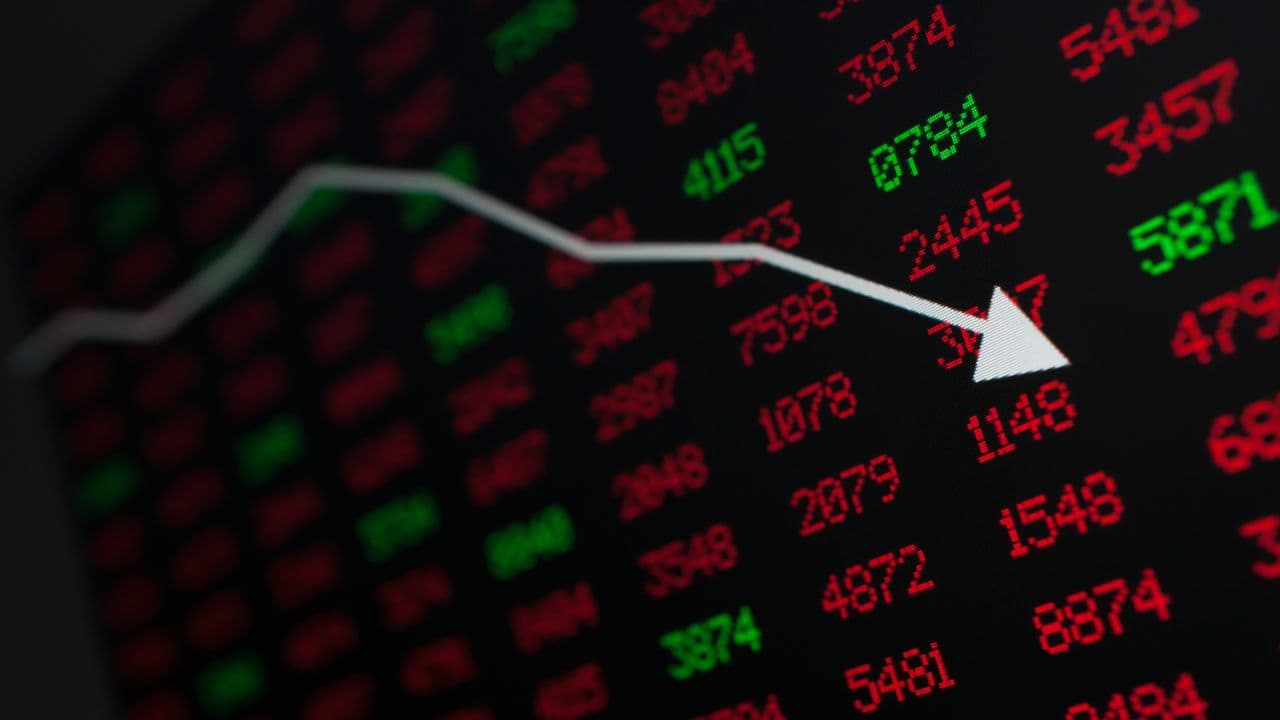
The Indian stock market, specifically the Nifty 50 and Bank Nifty indices, experienced a period of volatility and uncertainty, as detailed in a recent technical analysis. The Nifty 50 index, a benchmark for the Indian equity market, showed signs of a potential downtrend. The key support level of 22,700 proved crucial; a decisive break below this level could trigger further selling pressure, potentially pushing the index towards the next support zone at 22,500. Conversely, resistance levels were identified at 23,000 and 23,100, where significant Call option writing indicated strong resistance to upward movement. A breakthrough above these levels might propel the index towards 23,500. The daily candlestick pattern, described as bearish with upper and lower shadows resembling a high-wave pattern, highlighted the volatility present in the market. This pattern, coupled with a deteriorating Put-Call Ratio (PCR) – dropping from 0.82 to 0.74 – reinforces the bearish sentiment. The addition of substantial Call options at the 23,100 and 23,000 strike prices further solidified the resistance at those levels. This technical analysis suggests a potential continuation of the decline, particularly given the breaching of the previous swing low of 22,725.
Weekly performance also revealed a sense of indecision in the market, with the Nifty 50 forming a Doji-like candlestick pattern, indicating a struggle between bullish and bearish forces. Despite the short-term bearish outlook, some analysts remain optimistic, predicting a potential counter-trend pullback in the near future. One analyst, citing a reversal level at 22,600, suggested maintaining a positive stance on the index, expecting a shift in momentum. Monthly options data further indicated that the Nifty 50 might remain within a short-term trading range of 22,500 to 23,500. Analyzing the options data more specifically, the maximum Call open interest resided at the 24,000 strike, followed by 23,000 and 23,500, while maximum Call writing was concentrated at 23,100, followed by 22,800 and 23,000. On the Put side, the maximum open interest lay at the 22,000 strike, followed by 22,500 and 22,300, with maximum Put writing at 22,500, followed by 22,300 and 22,800. This detailed breakdown of open interest and option writing provides a granular picture of market sentiment and expectations.
The Bank Nifty index, another key indicator of the Indian market's performance, also exhibited bearish tendencies. A 353-point decline resulted in a bearish candlestick pattern on the daily charts, mirroring the high-wave pattern observed in the Nifty 50. The weekly chart also displayed a Doji-like candlestick pattern, though not a classical one, signifying indecisiveness. The closing price maintained the Wednesday low of 48,800, representing a crucial support level. A break below this level would likely embolden bearish forces. Analysts cautioned that any decisive movement in the Bank Nifty would require a breakout from the Wednesday range (49,628 to 48,804); until then, sideways trading within this zone was anticipated. A strategic approach for traders was suggested: going long near the 48,800 support, targeting 49,600 on the upside, while acknowledging that a sustained break below 48,800 might trigger further downside toward 48,400. The overall picture for Bank Nifty points to a fragile market susceptible to further declines if key support levels are breached.
Adding another layer of analysis, the India VIX, an indicator of market volatility, experienced a fourth consecutive session of decline, dropping 1.04% to the 14.53 zone. This indicates a decrease in the expected market volatility. The VIX now trades below all key moving averages. If this downward trend continues, it could signal a more favorable environment for bullish investors. The combination of technical indicators, options data, and volatility indices provides a comprehensive picture of the prevailing market sentiment and potential future direction. While short-term predictions are often uncertain, the analysis highlights crucial support and resistance levels that traders and investors should closely monitor to manage risk effectively. It is vital to remember that these analyses are based on technical observations and expert interpretations, and investment decisions should always be made after consulting certified financial advisors.